") 【Rust AI】01. 使用Jupyter學(xué)習(xí)Rust
【Rust AI】01. 使用Jupyter學(xué)習(xí)Rust
簡(jiǎn)介
大家(好的,其實(shí)是大多數(shù)人)都說 Rust 很難,但我不這么認(rèn)為。雖然 Rust 可能比 Python 稍微難一些,但我們可以像學(xué)習(xí) Python 一樣學(xué)習(xí) Rust - 通過使用 Jupyter。
在本文中,我將向你展示如何以交互模式編寫 Rust 代碼,特別是在數(shù)據(jù)科學(xué)場(chǎng)景中。
安裝
首先,你需要安裝 Python 開發(fā)的交互式筆記本 Jupyter。你可以通過以下方式安裝(我假設(shè)你之前已經(jīng)安裝了 Python):
pipinstalljupyterlab
請(qǐng)記得檢查安裝是否成功,請(qǐng)運(yùn)行以下命令:
jupyterlab
你將會(huì)看到一個(gè) Web 用戶界面,請(qǐng)立即關(guān)閉它。之后,我們需要安裝 Evcxr Jupyter Kernel,它是 Jupyter 的 Rust 內(nèi)核擴(kuò)展。你可以通過以下方式安裝(我假設(shè)你之前已經(jīng)在計(jì)算機(jī)上安裝了 Rust):
cargoinstall--lockedevcxr_jupyter
evcxr_jupyter--install
之后,再次啟動(dòng) Jupyter UI,你將看到類似于以下內(nèi)容:
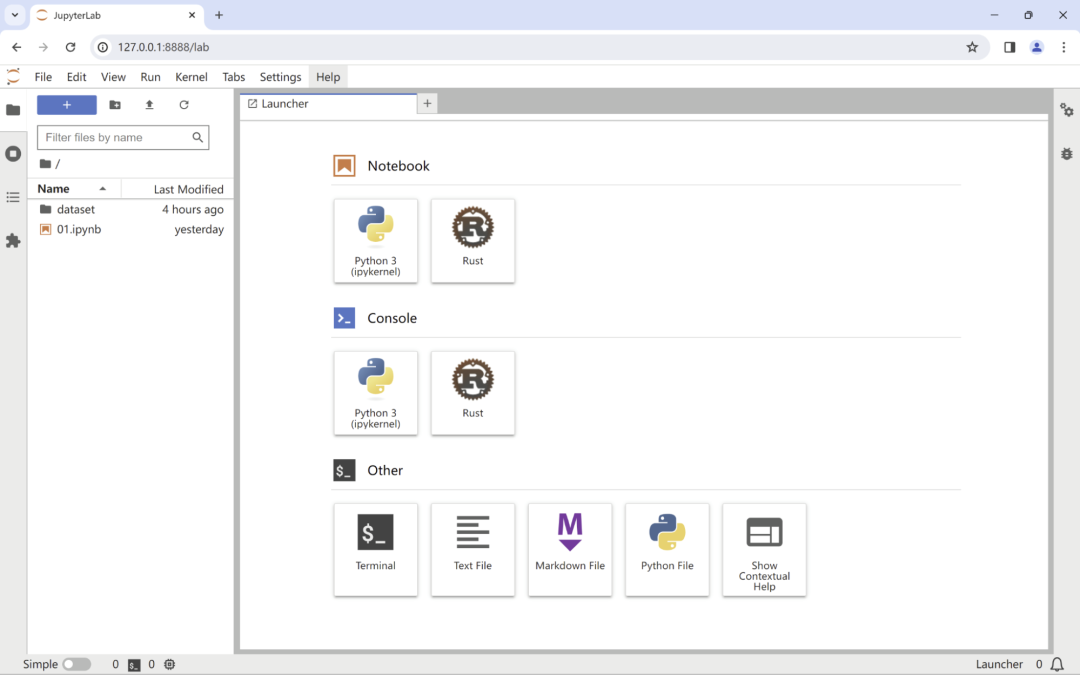
恭喜,我們?cè)趩?dòng)器面板上看到了 Rust 的標(biāo)志。
只需單擊 Notebook 部分下的 Rust 方塊,我們就可以得到:
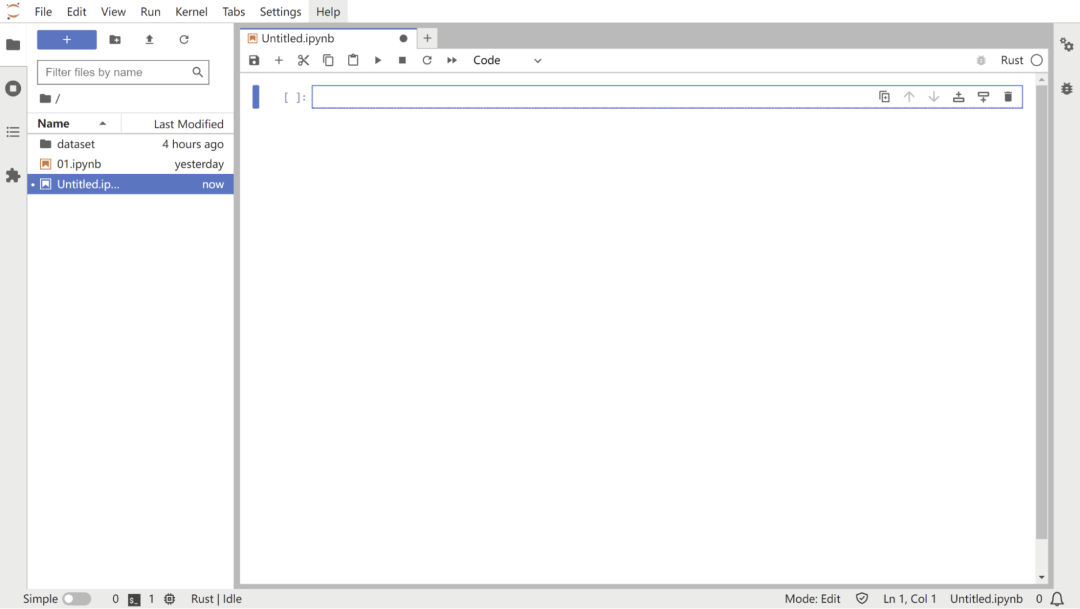
一切準(zhǔn)備就緒,我們開始吧!
基本操作
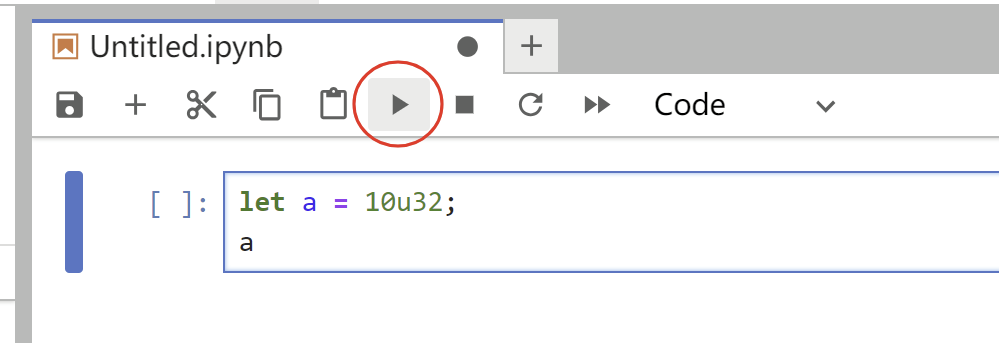
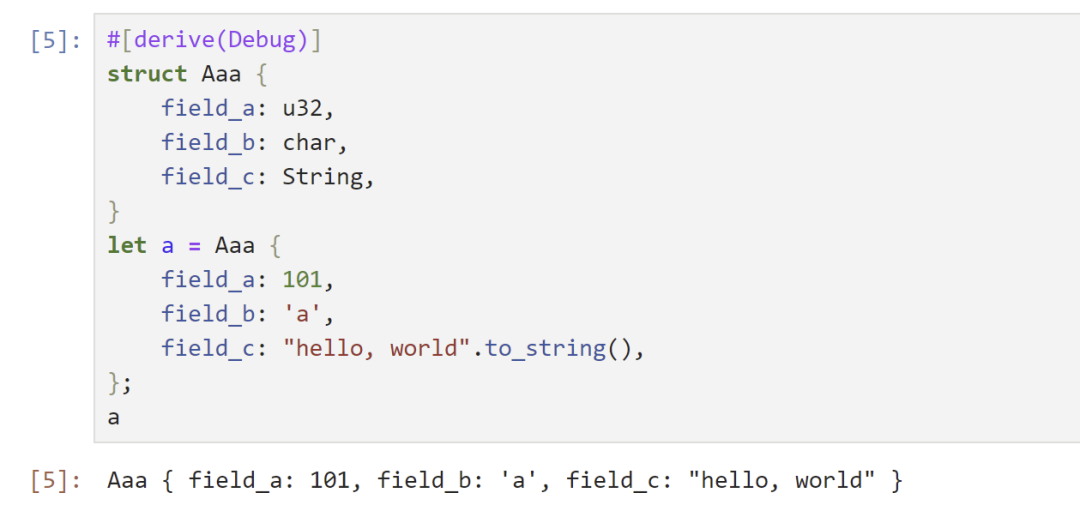
為了練習(xí)本教程,我建議你具備 Rust 語言的基本背景。讓我們從測(cè)試基本變量綁定開始,
輸出:
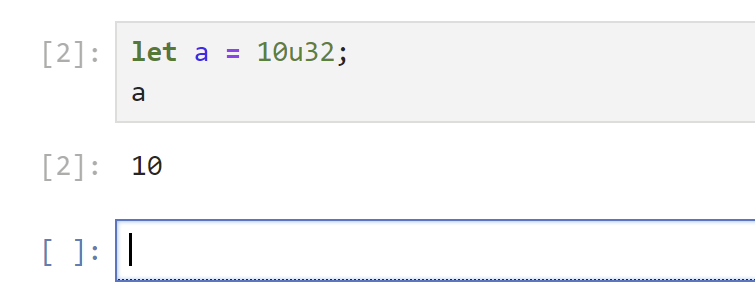
輸出會(huì)在 Rust 代碼下一行打印,是的,是交互式的。
讓我們繼續(xù)。
看起來一切都很順利。我們現(xiàn)在可以繼續(xù)進(jìn)行更復(fù)雜的任務(wù)。
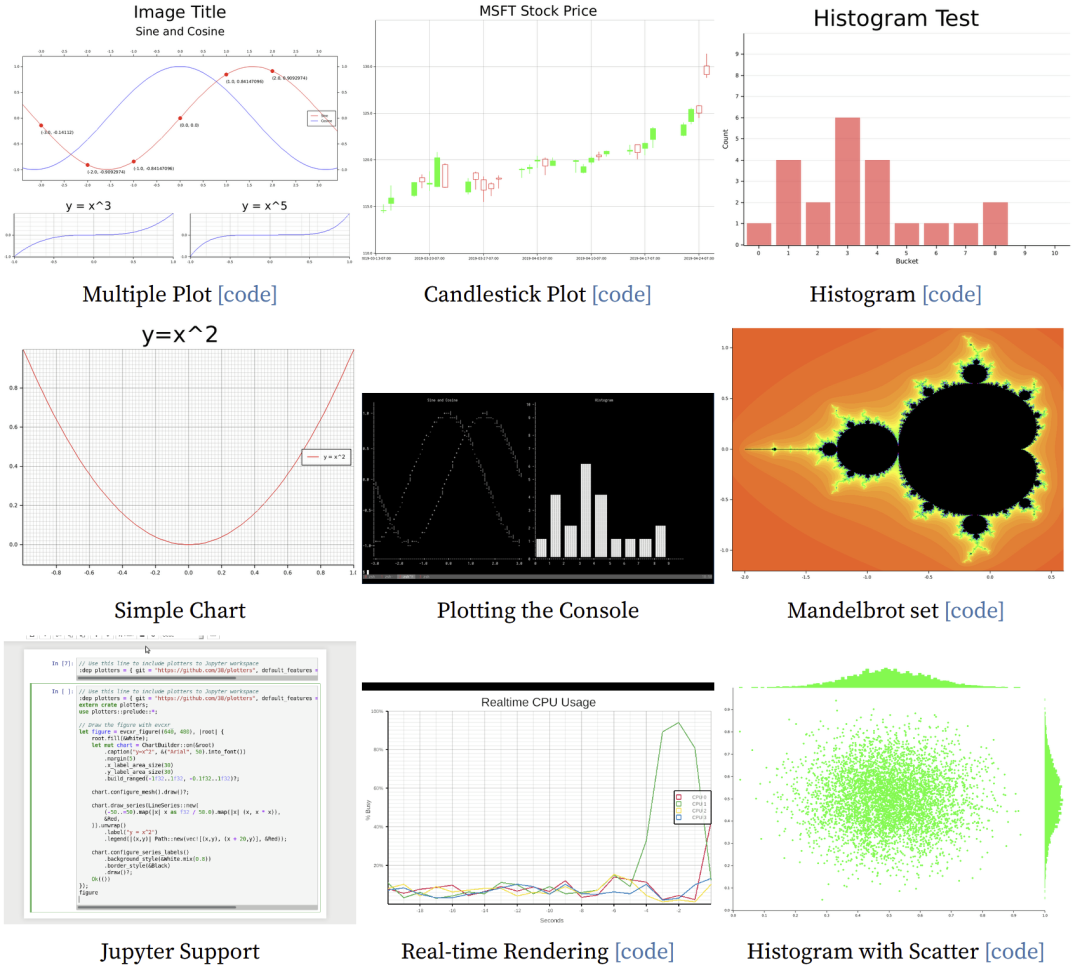
我們將利用三個(gè)數(shù)據(jù)科學(xué)工具:polars、ndarray 和 plotters,學(xué)習(xí)如何使用 Rust 進(jìn)行數(shù)據(jù)分析。
使用Polars分析數(shù)據(jù)集
在本教程中,我將選擇泰坦尼克號(hào)數(shù)據(jù)集作為示例,以說明 Rust 的便利性。
根據(jù) Bing 的說法:“泰坦尼克號(hào)數(shù)據(jù)集是用于數(shù)據(jù)科學(xué)和機(jī)器學(xué)習(xí)的流行數(shù)據(jù)集。它包含有關(guān)泰坦尼克號(hào)上的乘客的信息,包括年齡、性別、等級(jí)、票價(jià)以及他們是否在災(zāi)難中幸存。這個(gè)數(shù)據(jù)集經(jīng)常用于預(yù)測(cè)建模練習(xí),例如根據(jù)乘客的特征預(yù)測(cè)乘客是否能夠幸存。這是一個(gè)適合數(shù)據(jù)分析和機(jī)器學(xué)習(xí)初學(xué)者的經(jīng)典數(shù)據(jù)集,廣泛用于 Kaggle 競(jìng)賽。”
我們可以從這里(https://huggingface.co/datasets/phihung/titanic)下載泰坦尼克號(hào)數(shù)據(jù)集,并將其移動(dòng)到 dataset/ 子目錄中。
添加依賴:
:depndarray={version="0.15.6"}
:deppolars={version="0.35.4",features=["describe","lazy","ndarray"]}
:depplotters={version="0.3.5",default_features=false,features=["evcxr","all_series","all_elements"]}
顯示依賴:
:show_deps
輸出:
ndarray={version="0.15.6"}
plotters={version="0.3.5",default_features=false,features=["evcxr","all_series","all_elements"]}
polars={version="0.35.4",features=["describe","lazy","ndarray"]}
將數(shù)據(jù)集讀入 polars 內(nèi)存:
usepolars::*;
usepolars::DataFrame;
usestd::Path;

fnread_data_frame_from_csv(
csv_file_path:&Path,
)->DataFrame{
CsvReader::from_path(csv_file_path)
.expect("Cannotopenfile.")
.has_header(true)
.finish()
.unwrap()
}

lettitanic_file_path:&Path=Path::new("dataset/titanic.csv");
lettitanic_df:DataFrame=read_data_frame_from_csv(titanic_file_path);
查看數(shù)據(jù)的形狀:
titanic_df.shape()
輸出:
(891,12)
DataFrame 是 polars 中的基本結(jié)構(gòu),與 Python Pandas 中的 DataFrame 相同,你可以將其視為具有每列命名標(biāo)題的二維數(shù)據(jù)表格。
以下是查看數(shù)據(jù)集基本統(tǒng)計(jì)信息的代碼示例:
titanic_df.describe(None)
輸出: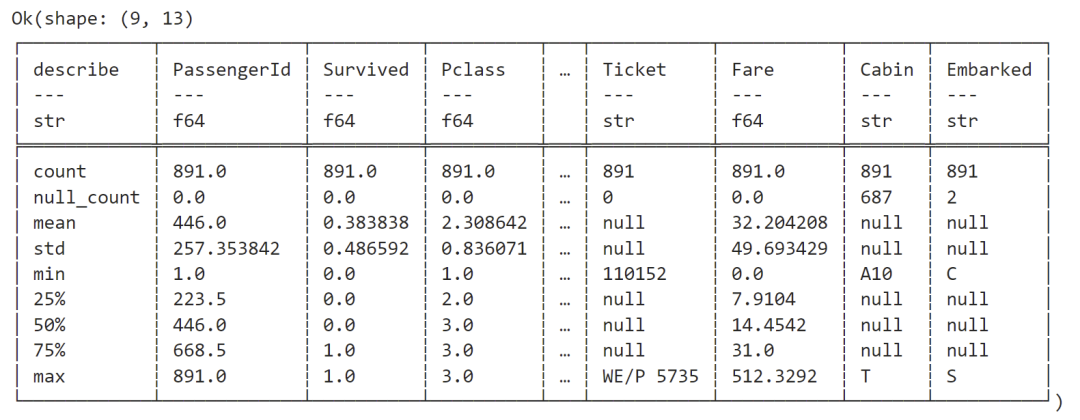
我們可以看到這個(gè)數(shù)據(jù)集中有一些空單元格。
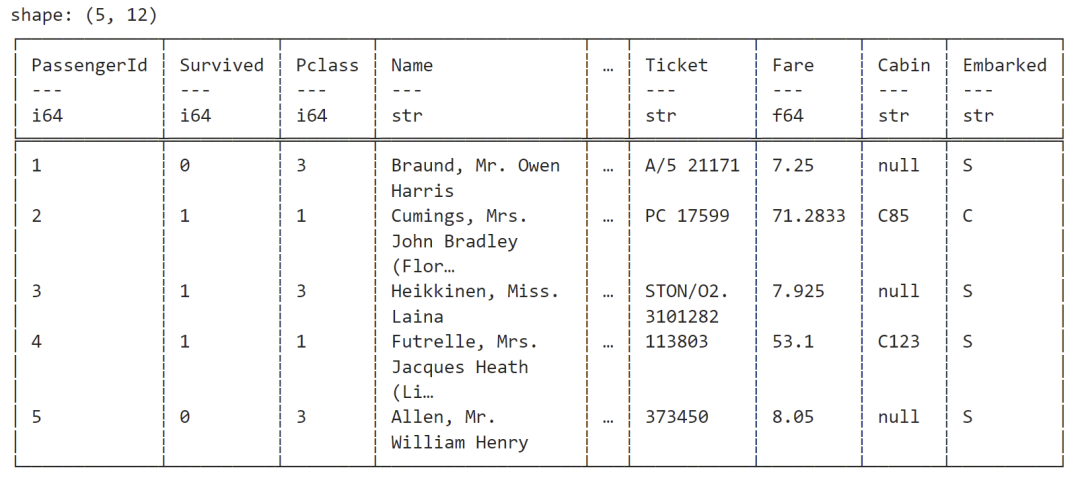
以下是查看數(shù)據(jù)集前 5 行的代碼示例:
titanic_df.head(Some(5))
輸出:
如果你想查看數(shù)據(jù)集中的列名,請(qǐng)使用 .schema() 方法。以下是代碼示例:
titanic_df.schema()
輸出:
Schema:
name:PassengerId,datatype:Int64
name:Survived,datatype:Int64
name:Pclass,datatype:Int64
name:Name,datatype:String
name:Sex,datatype:String
name:Age,datatype:Float64
name:SibSp,datatype:Int64
name:Parch,datatype:Int64
name:Ticket,datatype:String
name:Fare,datatype:Float64
name:Cabin,datatype:String
name:Embarked,datatype:String
使用以下代碼來查看泰坦尼克號(hào)數(shù)據(jù)集中幸存者:
titanic_df["Survived"].value_counts(true,true)
輸出:
Ok(shape:(2,2)
┌──────────┬───────┐
│Survived┆count│
│---┆---│
│i64┆u32│
╞══════════╪═══════╡
│0┆549│
│1┆342│
└──────────┴───────┘)
查看泰坦尼克號(hào)數(shù)據(jù)集中的性別分布:
titanic_df["Sex"].value_counts(true,true)
輸出:
Ok(shape:(2,2)
┌────────┬────────┐
│Sex┆counts│
│---┆---│
│str┆u32│
╞════════╪════════╡
│male┆577│
│female┆314│
└────────┴────────┘)
你可以在 titanic_df DataFrame 上繼續(xù)進(jìn)行更復(fù)雜的 EDA(探索性數(shù)據(jù)分析)。
使用Plotters對(duì)數(shù)據(jù)可視化
接下來,我們可以使用 plotters crate 來可視化我們的輸出數(shù)據(jù)。以下是導(dǎo)入 plotters crate 的符號(hào):
useplotters::*;
畫一個(gè)柱狀圖:
evcxr_figure((640,480),|root|{
letdrawing_area=root;
drawing_area.fill(&WHITE).unwrap();

letmutchart_context=ChartBuilder::on(&drawing_area)
.caption("TitanicDataset",("Arial",30).into_font())
.x_label_area_size(40)
.y_label_area_size(40)
.build_cartesian_2d((0..1).into_segmented(),0..800)?;

chart_context.configure_mesh()
.x_desc("Survived?")
.y_desc("Number").draw()?;

letdata_s:DataFrame=titanic_df["Survived"].value_counts(true,true).unwrap().select(vec!["counts"]).unwrap();
letmutdata_source=data_s.to_ndarray::(IndexOrder::Fortran).unwrap().into_raw_vec().into_iter();

chart_context.draw_series((0..).zip(data_source).map(|(x,y)|{
letx0=SegmentValue::Exact(x);
letx1=SegmentValue::Exact(x+1);
letmutbar=Rectangle::new([(x0,0),(x1,y)],BLUE.filled());
bar.set_margin(0,0,30,30);
bar
}))
.unwrap();

Ok(())
}).style("width:60%")
顯示: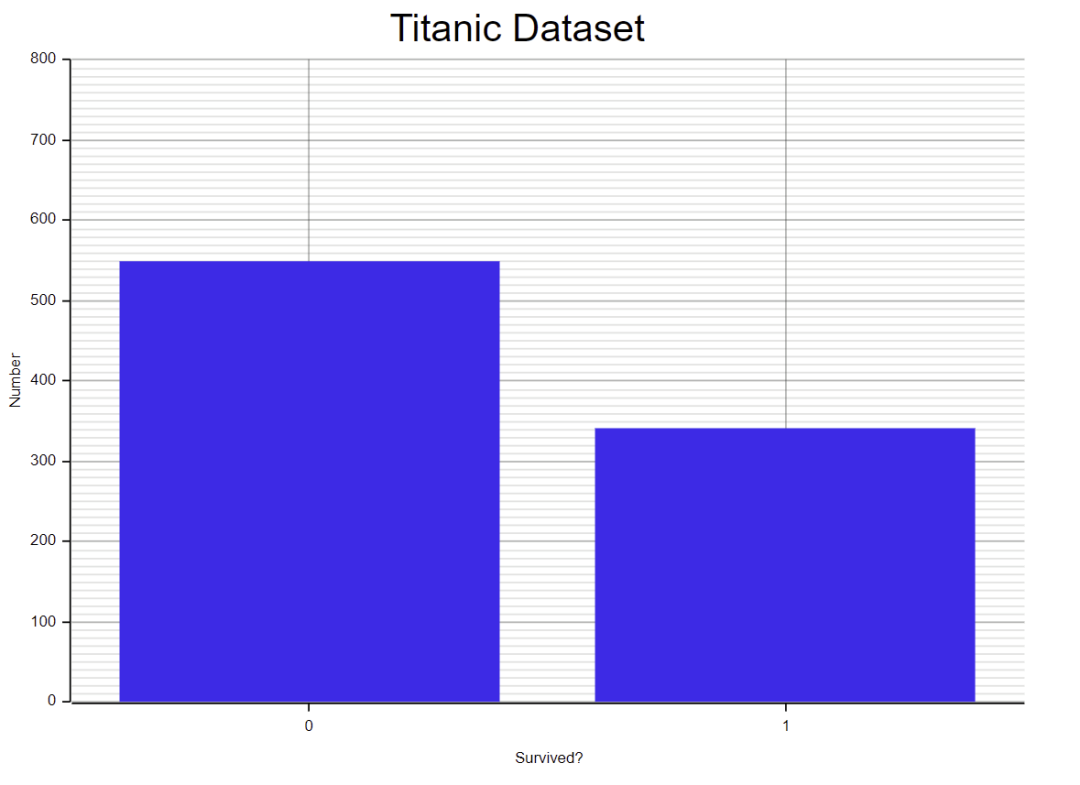
這段代碼看起來有些冗長(zhǎng)和繁瑣,以后最好在 plotters 中封裝一個(gè)簡(jiǎn)單的 API 。現(xiàn)在的核心問題是 1. 配置項(xiàng)過多,2. 類型轉(zhuǎn)換復(fù)雜。
Plotters 支持各種圖形、繪圖和圖表,你可以將 plotters 視為 Rust 生態(tài)系統(tǒng)中 Python matplotlib 的對(duì)應(yīng)物,但它要趕上 matplotlib 的易用性,還有不小的差距。
有關(guān) plotters 的更多信息,請(qǐng)?jiān)L問:https://docs.rs/plotters/latest/plotters/
接下來,我們將介紹矩陣操作庫(kù) ndarray。
使用Ndarray操作矩陣
DataFrame 有一個(gè)方法可以將自身轉(zhuǎn)換為 Ndarray 的多維矩陣。例如:
leta=UInt32Chunked::new("a",&[1,2,3]).into_series();
letb=Float64Chunked::new("b",&[10.,8.,6.]).into_series();

letdf=DataFrame::new(vec![a,b]).unwrap();
letndarray=df.to_ndarray::(IndexOrder::Fortran).unwrap();
println!("{:?}",ndarray);
將輸出:
[[1.0,10.0],
[2.0,8.0],
[3.0,6.0]],shape=[3,2],strides=[1,3],layout=Ff(0xa),constndim=2
我們可以使用 ndarray crate 來進(jìn)行復(fù)雜的矩陣操作。
導(dǎo)入 ndarray crate 的符號(hào):
usendarray::*;
創(chuàng)建一個(gè) 2x3 矩陣:
array![[1.,2.,3.],[4.,5.,6.]]
輸出:
[[1.0,2.0,3.0],
[4.0,5.0,6.0]],shape=[2,3],strides=[3,1],layout=Cc(0x5),constndim=2
創(chuàng)建一個(gè)范圍:
Array::range(0.,10.,0.5)
輸出:
[0.0,0.5,1.0,1.5,2.0,2.5,3.0,3.5,4.0,4.5,5.0,5.5,6.0,6.5,7.0,7.5,8.0,8.5,9.0,9.5],shape=[20],strides=[1],layout=CFcf(0xf),constndim=1
創(chuàng)建一個(gè)具有指定相等間隔的范圍:
Array::linspace(0.,10.,18)
輸出:
[0.0,0.5882352941176471,1.1764705882352942,1.7647058823529411,2.3529411764705883,2.9411764705882355,3.5294117647058822,4.11764705882353,4.705882352941177,5.294117647058823,5.882352941176471,6.470588235294118,7.0588235294117645,7.647058823529412,8.23529411764706,8.823529411764707,9.411764705882353,10.0],shape=[18],strides=[1],layout=CFcf(0xf),constndim=1
以下是創(chuàng)建一個(gè) 3x4x5 矩陣(也稱為機(jī)器學(xué)習(xí)中的“張量”)的代碼示例:
Array::::ones((3,4,5))
輸出:
[[[1.0,1.0,1.0,1.0,1.0],
[1.0,1.0,1.0,1.0,1.0],
[1.0,1.0,1.0,1.0,1.0],
[1.0,1.0,1.0,1.0,1.0]],

[[1.0,1.0,1.0,1.0,1.0],
[1.0,1.0,1.0,1.0,1.0],
[1.0,1.0,1.0,1.0,1.0],
[1.0,1.0,1.0,1.0,1.0]],

[[1.0,1.0,1.0,1.0,1.0],
[1.0,1.0,1.0,1.0,1.0],
[1.0,1.0,1.0,1.0,1.0],
[1.0,1.0,1.0,1.0,1.0]]],shape=[3,4,5],strides=[20,5,1],layout=Cc(0x5),constndim=3
以下是創(chuàng)建一個(gè)零值初始矩陣的代碼示例:
Array::::zeros((3,4,5))
輸出:
[[[0.0,0.0,0.0,0.0,0.0],
[0.0,0.0,0.0,0.0,0.0],
[0.0,0.0,0.0,0.0,0.0],
[0.0,0.0,0.0,0.0,0.0]],

[[0.0,0.0,0.0,0.0,0.0],
[0.0,0.0,0.0,0.0,0.0],
[0.0,0.0,0.0,0.0,0.0],
[0.0,0.0,0.0,0.0,0.0]],

[[0.0,0.0,0.0,0.0,0.0],
[0.0,0.0,0.0,0.0,0.0],
[0.0,0.0,0.0,0.0,0.0],
[0.0,0.0,0.0,0.0,0.0]]],shape=[3,4,5],strides=[20,5,1],layout=Cc(0x5),constndim=3
對(duì)行和列求和
letarr=array![[1.,2.,3.],[4.,5.,6.]];
按行求和
arr.sum_axis(Axis(0))
輸出:
[5.0,7.0,9.0],shape=[3],strides=[1],layout=CFcf(0xf),constndim=1
按列求和:
arr.sum_axis(Axis(1))
輸出:
[6.0,15.0],shape=[2],strides=[1],layout=CFcf(0xf),constndim=1
所有元素求和:
arr.sum()
輸出:
21.0
矩陣轉(zhuǎn)置:
arr.t()
輸出:
[[1.0,4.0],
[2.0,5.0],
[3.0,6.0]],shape=[3,2],strides=[1,3],layout=Ff(0xa),constndim=2
求點(diǎn)積:
arr.dot(&arr.t())
輸出:
[[14.0,32.0],
[32.0,77.0]],shape=[2,2],strides=[2,1],layout=Cc(0x5),constndim=2
求方根:
arr.mapv(f64::sqrt)
輸出:
[[1.0,1.4142135623730951,1.7320508075688772],
[2.0,2.23606797749979,2.449489742783178]],shape=[2,3],strides=[3,1],layout=Cc(0x5),constndim=2
矩陣操作暫時(shí)演示到這里。ndarray 是一個(gè)非常強(qiáng)大的工具,你可以使用它來執(zhí)行與矩陣和線性代數(shù)相關(guān)的任何任務(wù)。
回顧
在本文中,我演示了如何使用 Jupyter 交互式地學(xué)習(xí) Rust。Jupyter 是數(shù)據(jù)科學(xué)家(或?qū)W生)的超級(jí)工具,我們現(xiàn)在可以使用 Rust 在 Jupyter 中完成探索性數(shù)據(jù)分析任務(wù)。Polars、plotters 和 ndarray 是強(qiáng)大的工具集,可以幫助我們處理數(shù)據(jù)分析和數(shù)據(jù)預(yù)處理工作,這是后續(xù)機(jī)器學(xué)習(xí)任務(wù)的先決條件。
-
機(jī)器學(xué)習(xí)
+關(guān)注
關(guān)注
66文章
8441瀏覽量
133087 -
數(shù)據(jù)集
+關(guān)注
關(guān)注
4文章
1209瀏覽量
24835 -
Rust
+關(guān)注
關(guān)注
1文章
230瀏覽量
6665
原文標(biāo)題:【Rust AI】01. 使用Jupyter學(xué)習(xí)Rust
文章出處:【微信號(hào):Rust語言中文社區(qū),微信公眾號(hào):Rust語言中文社區(qū)】歡迎添加關(guān)注!文章轉(zhuǎn)載請(qǐng)注明出處。
發(fā)布評(píng)論請(qǐng)先 登錄
相關(guān)推薦
Rust GUI實(shí)踐之Rust-Qt模塊
Rust語言如何與 InfluxDB 集成
只會(huì)用Python?教你在樹莓派上開始使用Rust
怎樣去使用Rust進(jìn)行嵌入式編程呢
如何利用C語言去調(diào)用rust靜態(tài)庫(kù)呢
在Rust代碼中加載靜態(tài)庫(kù)時(shí),出現(xiàn)錯(cuò)誤 ` rust-lld: error: undefined symbol: malloc `怎么解決?

以調(diào)試Rust的方式來學(xué)習(xí)Rust
Chromium正式開始支持Rust
rust語言基礎(chǔ)學(xué)習(xí): 智能指針之Cow
rust語言基礎(chǔ)學(xué)習(xí): rust中的錯(cuò)誤處理
Rust的內(nèi)部工作原理
谷歌程序員認(rèn)為學(xué)習(xí)Rust很easy


 工商網(wǎng)監(jiān)
評(píng)論